
Reading the Project Profitability report
How Keepr compares what you quoted against the hours you actually worked, so you can spot the projects that are quietly losing you money.
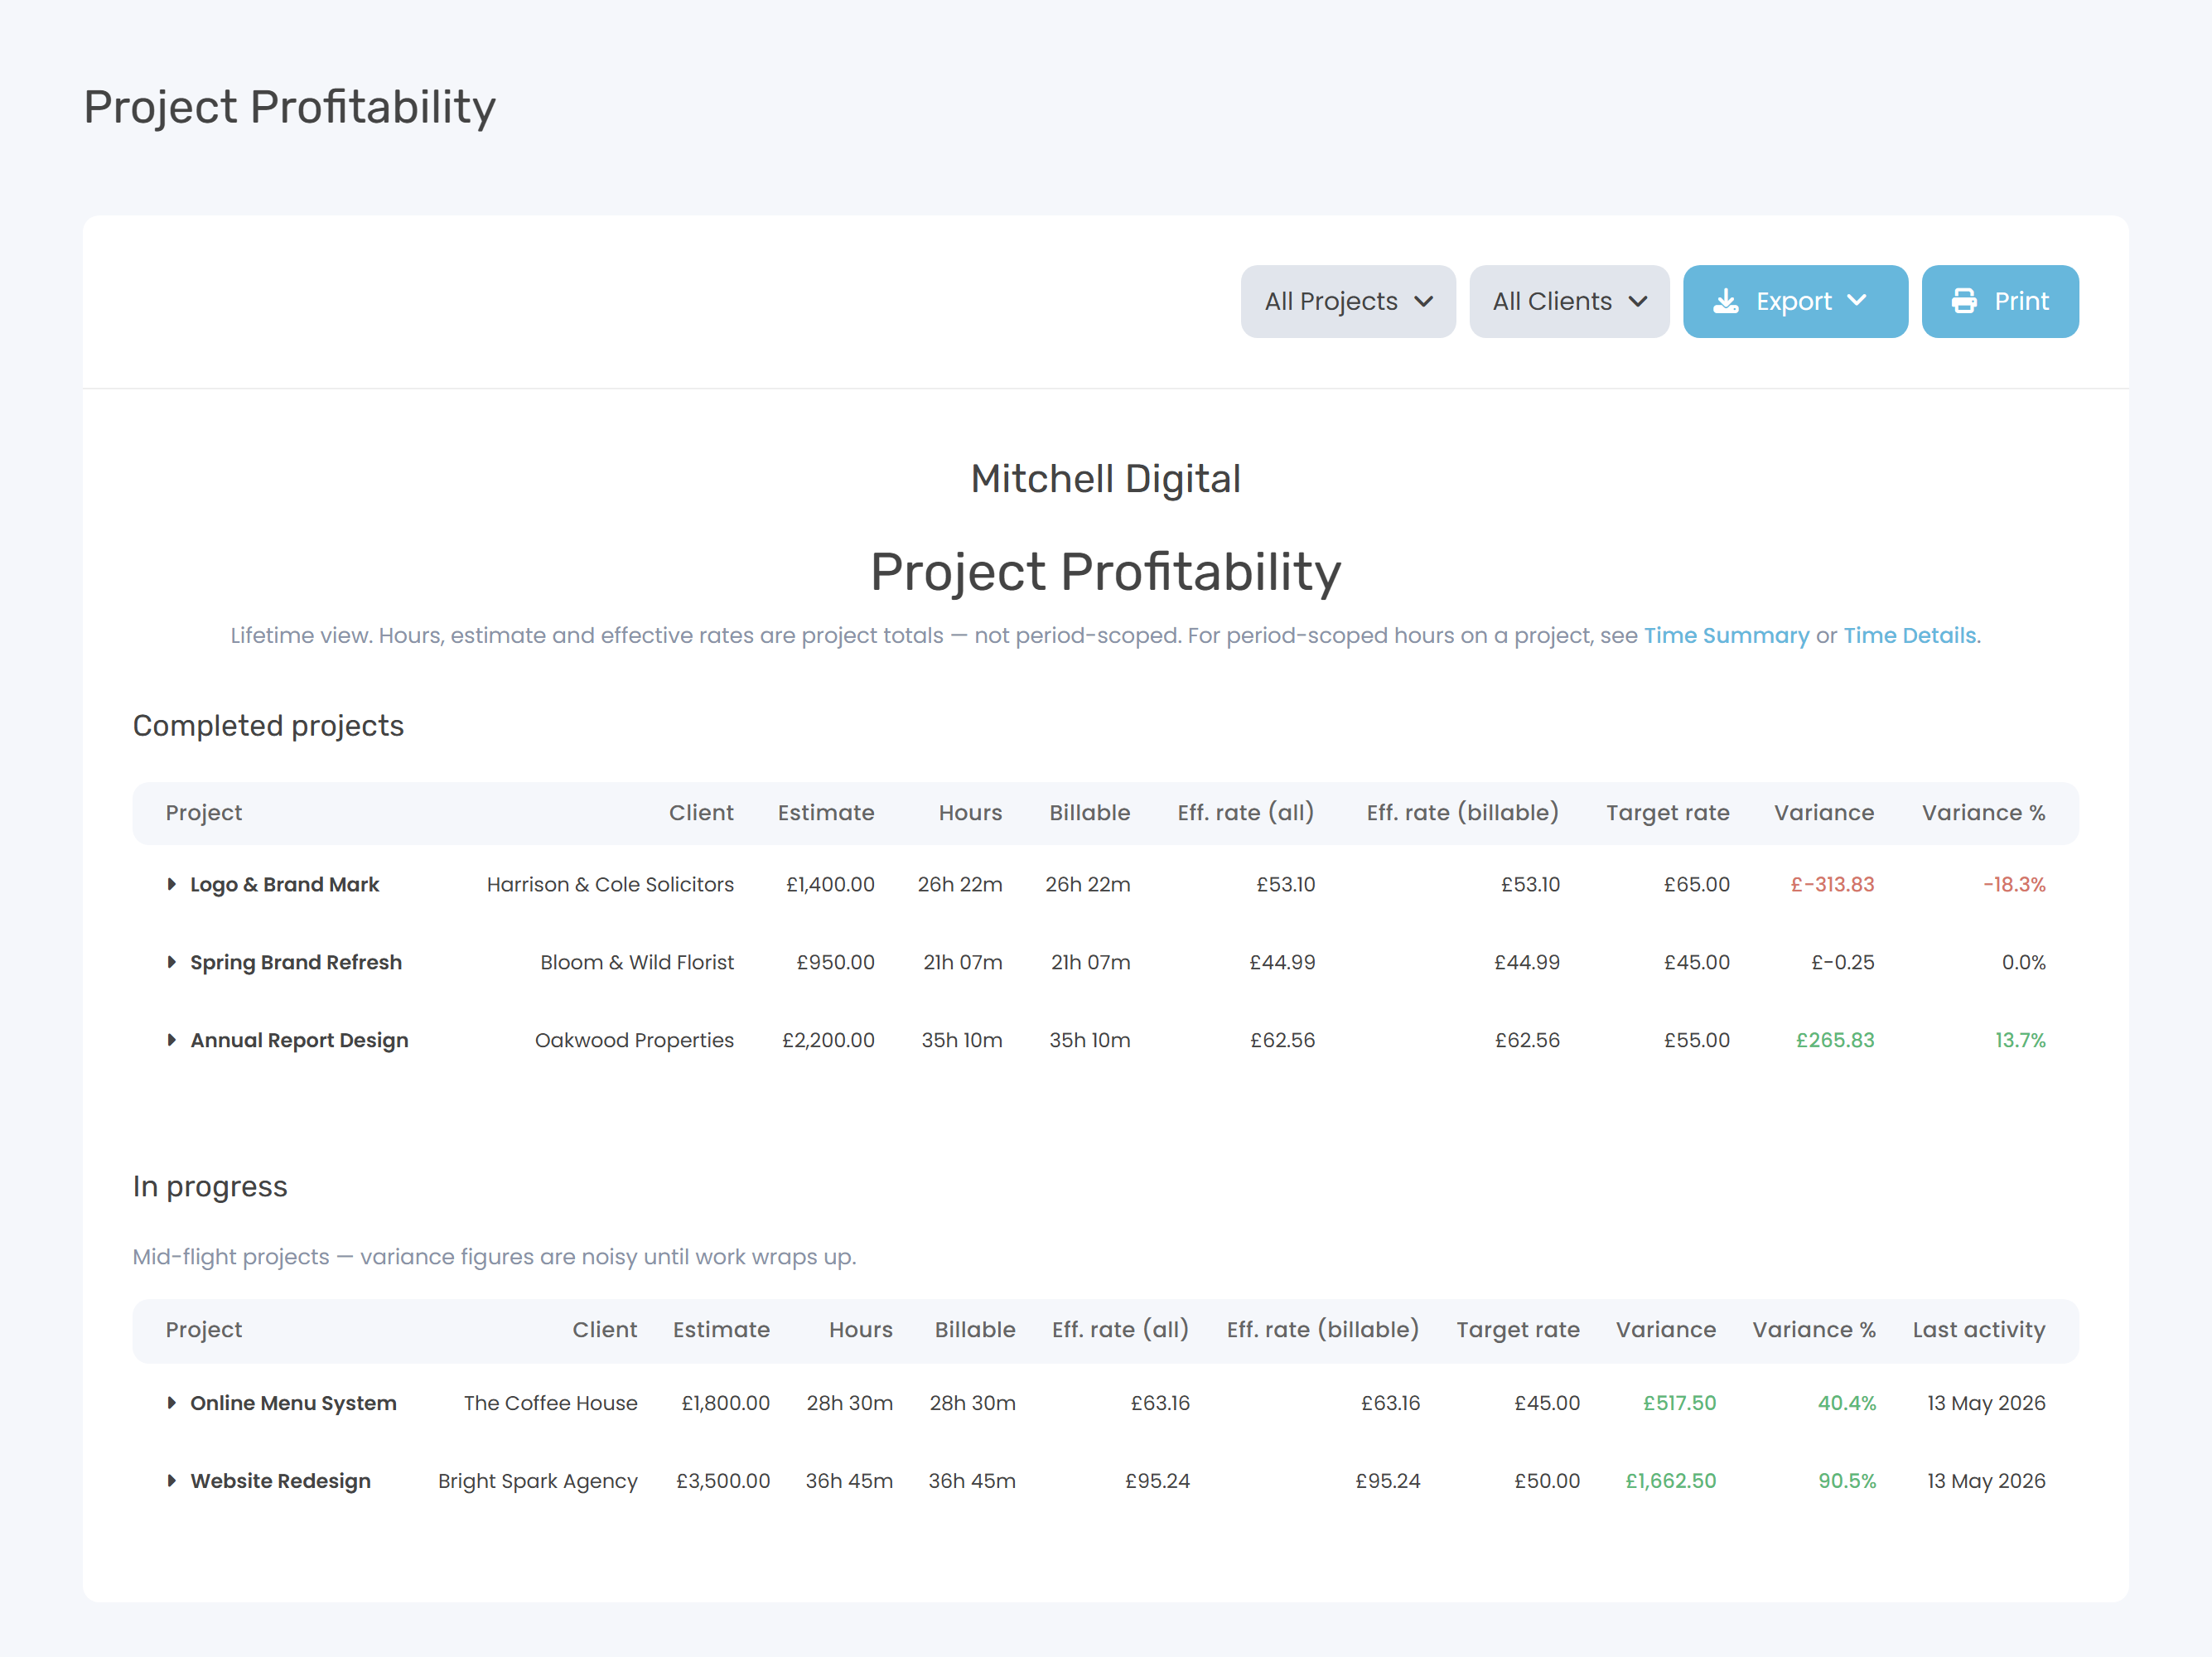
Project Profitability answers one question: was the price I quoted actually worth my time? For every project with hours logged, Keepr divides the agreed estimate by the hours worked and compares the result against the rate you'd normally charge. You'll find it at Project Profitability - or click Reports in the sidebar and pick the Project Profitability card.
What it measures (and why it uses the estimate, not the invoiced total)
The headline number is the effective hourly rate: estimate ÷ hours worked. That's what you actually earned per hour on the project, regardless of how the invoicing was sliced up.
Keepr deliberately uses the estimate rather than the total you invoiced. The question is “how accurately did I quote this project?” - and the input to that is the price you agreed, not the cash that happened to land. For invoiced revenue per client, the Revenue by Client report covers that.
The target rate cascade
To know whether the effective rate is good or bad, Keepr compares it against a target rate. The target is resolved in this order, taking the first one that's set:
| Order | Source | Where to set it |
|---|---|---|
| 1 | Project hourly rate | On the project itself - Hourly rate field. |
| 2 | Client hourly rate | On the client - used if the project doesn't have its own rate. |
| 3 | Your default rate | Settings → Hourly rate - the fallback if nothing project- or client-specific is set. |
If none of the three is set, the target columns show - and there's no variance figure (Keepr won't make up a benchmark for you).
The three sections
Projects with hours logged are split into three buckets, in this order down the page:
| Section | What it contains |
|---|---|
| Completed projects | Archived projects. The most reliable signal - the work is done, so the variance is final. |
| In progress | Active projects. A grey caveat sits above this table: variance figures are noisy until the work wraps up, because you've already used the full estimate but the hours are still climbing. |
| Estimate not set | Projects with hours logged but no estimate. They can't be measured yet - set an estimate to bring them into the tracking. |
Within each section, rows are sorted worst variance first. The projects that lost you the most money are at the top - that's normally what you came here to find.
Reading the columns
| Column | What it shows |
|---|---|
| Project | Project title. A small note icon appears if you've added estimate notes - hover for the text. |
| Client | The client this project belongs to (or No Client). |
| Estimate | The agreed value you saved on the project. |
| Hours | Lifetime hours logged on the project (e.g. 12h 30m). |
| Billable | Of those hours, the ones marked billable. |
| Eff. rate (all) | Estimate ÷ total hours. |
| Eff. rate (billable) | Estimate ÷ billable hours only. Useful if you've logged a lot of non-billable admin against the project. |
| Target rate | From the cascade above. |
| Variance | The £ shortfall (or surplus): estimate minus (target rate × hours). |
| Variance % | How far above or below the target rate the effective rate landed. |
| Last activity | In progress table only - the date of the most recent time entry. |
The variance cells are colour-coded so the eye lands on them: red when you're more than 10% below target, green when you're more than 5% above, and neutral in between.
Drill into a project for the task breakdown
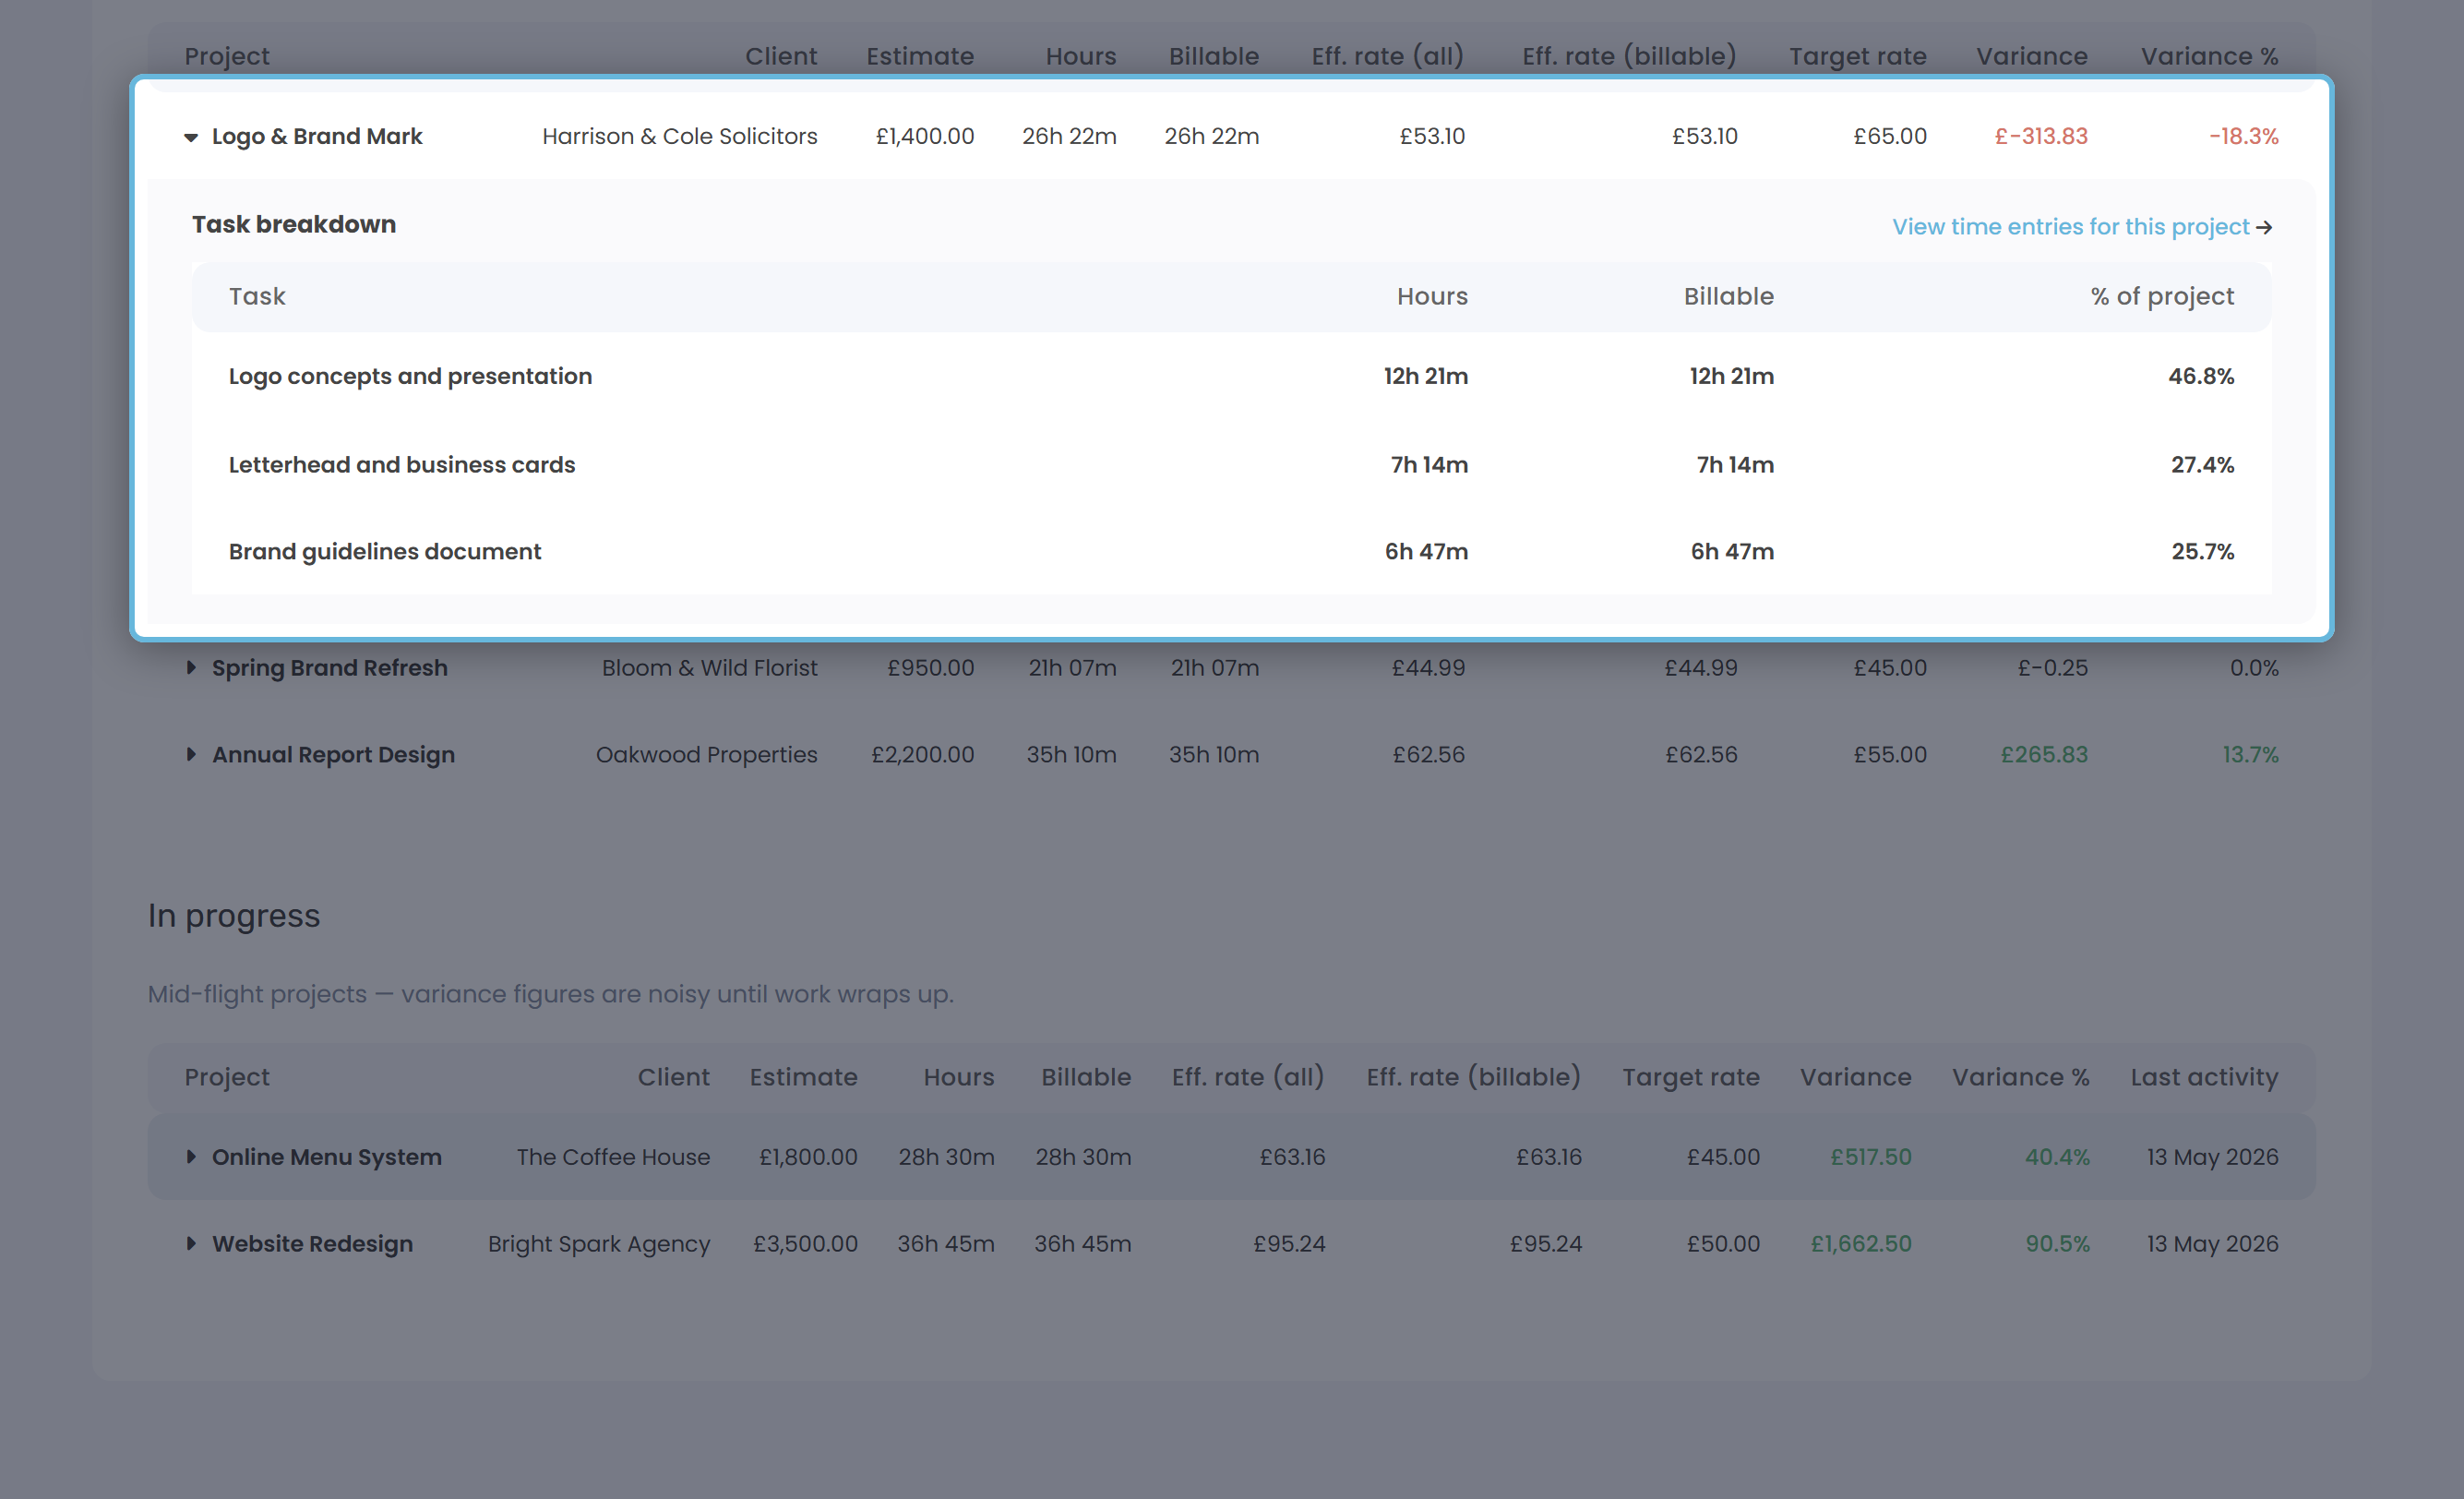
Click a project row to expand a task breakdown: every task logged on that project with hours, billable hours and its share of the project's total time. That's usually where the answer lives - “OK, where did the hours actually go?”
There's a “View time entries for this project →” link in the breakdown that opens Time Details filtered to that project, in case you want to see the individual sessions.
Filtering, exporting, printing
| Control | What it does |
|---|---|
| Status dropdown | All Projects (default), Active only, or Archived only. |
| Client dropdown | Scope the report to a single client. Live search if you have a lot of them. |
| Export | CSV or Excel (.xlsx). Columns match the on-screen tables; the “Estimate not set” section is excluded (there's nothing measurable to export). |
| Uses your browser's print dialog. |
Worked example
You quote a client £2,000 for a marketing site. No per-project rate, but your default is £45/hour. By the time the project is archived, you've logged 50 hours (all billable).
| Column | Value |
|---|---|
| Estimate | £2,000.00 |
| Hours | 50h 00m |
| Eff. rate (all) | £40.00 / hour |
| Target rate | £45.00 / hour |
| Variance | −£250.00 |
| Variance % | −11.1% |
The effective rate is below the target, so the variance cells go red. The £ figure (−£250) is the gap between what you agreed and what the work was worth at your normal rate - your quote left £250 on the table. Next time, factor in another 5 hours of contingency, or quote closer to £2,250.
How to use it
| Use case | How |
|---|---|
| Spot under-quoted projects | Sort is already worst-first. Open the Completed projects section and look at the top of the list - anything red is a quote that didn't cover the work. |
| Refine your next quote | Expand the project's task breakdown. The tasks eating the biggest slice of hours are usually the ones being under-estimated. |
| Catch in-flight projects before they slip | Check the In progress section every week or two. If a project is already underwater while you're still working on it, decide now whether to scope back or raise the next quote. |
| Decide which clients are profitable | If the same client appears in red repeatedly, that's a pattern. The Client Profitability report rolls this up per client. |