
Reading the Revenue by Client report in Keepr
Spot your biggest clients, watch for concentration risk, and see who's growing year on year - all from one report.
The Revenue by Client report tells you, at a glance, which clients are paying the bills. It's a single grid: clients down the side, calendar months across the top, total on the right. You'll find it at Revenue by Client - or click Reports in the sidebar and pick the Revenue by Client card.
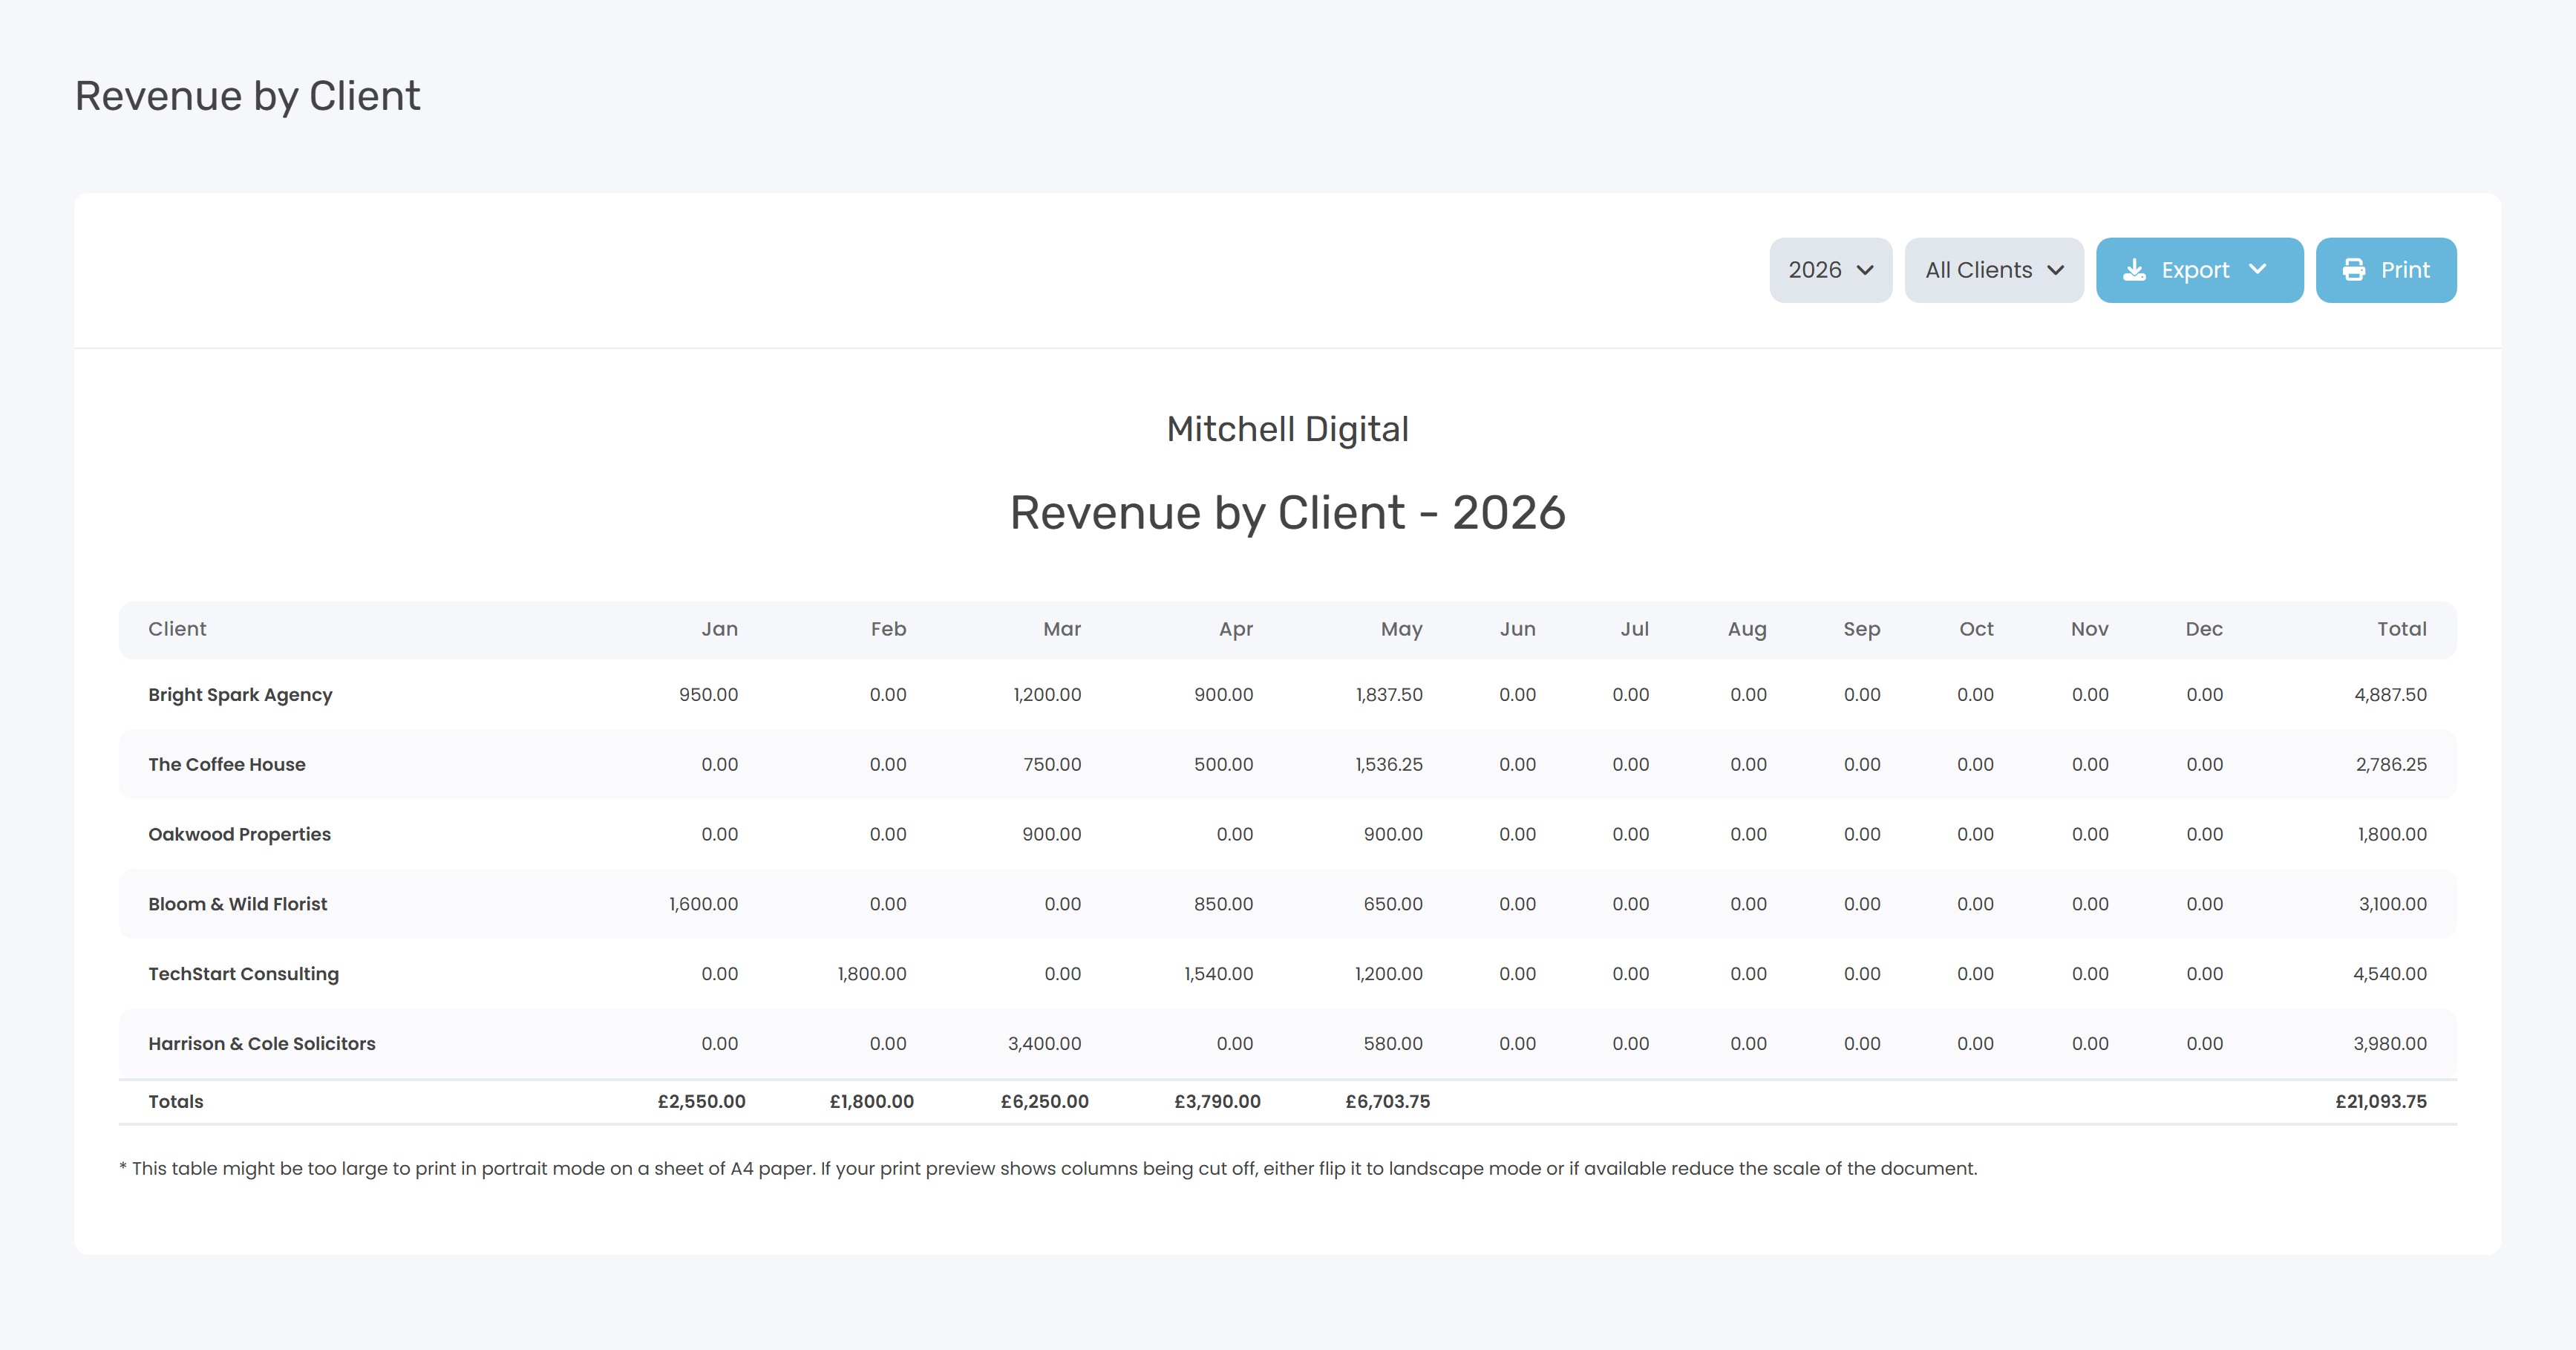
What it shows
| Row / column | What it means |
|---|---|
| A client row | Every client who invoiced any revenue in the chosen year. Clients with zero in the year are hidden. |
| Jan to Dec | Net revenue from that client, by the month it was billed. The picker is a calendar year, not a tax year. |
| Total | The client's full-year total. |
| Totals row (bottom) | Sum of every client row, per month and overall - your year-to-year top line. |
Filters at the top of the report
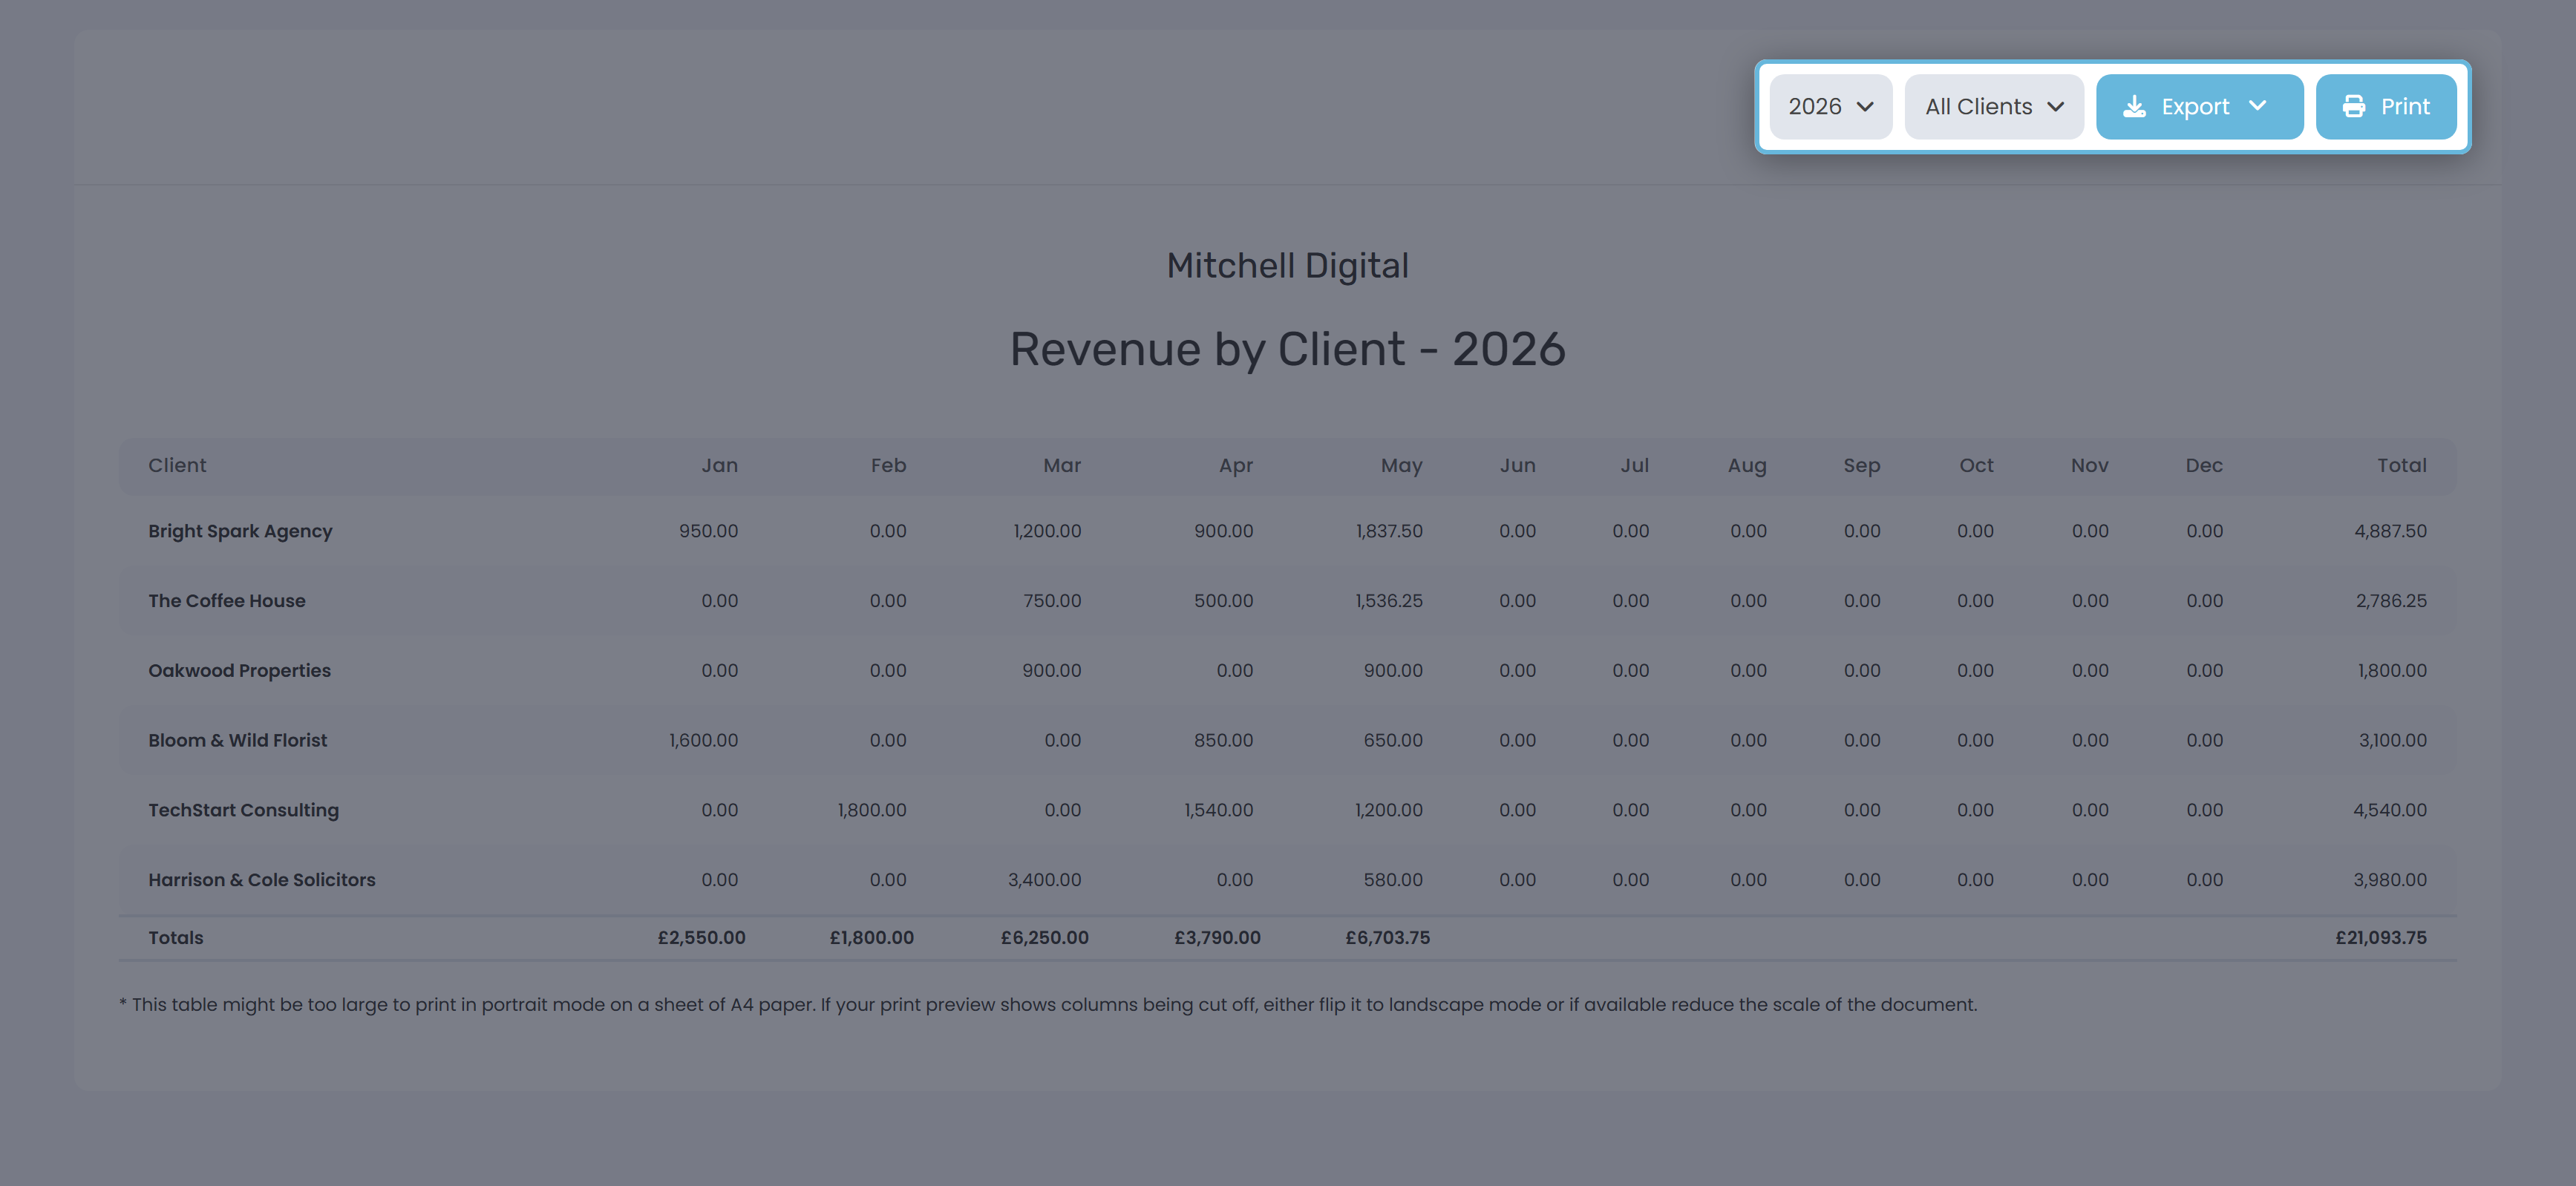
Year
Defaults to the current calendar year. You can pick any of the last 14 years. Note this is the calendar year - a sole trader's UK tax year (6 April to 5 April) sits across two report runs.
Client
Defaults to All Clients. Start typing to filter the list - useful if you've got a long roster. Pick a single client to narrow the table down to one row; handy for printing a one-client revenue history before a rate-rise conversation.
Export and Print
Export gives you CSV or Excel (.xlsx), one row per client. The Customise… option opens a modal where you can tick which of the 14 columns appear in your export - the selection is remembered next time. Print uses your browser's print dialog and forces landscape A4 so the 14 columns fit on one sheet.
SUM() formula after opening the file.What counts as revenue here
| Included | Not included |
|---|---|
| Invoices on their invoice date, paid or not | Voided / deleted invoices |
| Other Income entries with a client attached | Cash sales logged with no client - they're invisible on this report |
| Net line totals (ex-tax) | Tax collected on top of the net - that's on the Tax Summary report |
Worked example
Here's the report for a freelancer's calendar year 2025 - five clients invoiced across the year, ~£49,800 net total. (The same business's full UK tax year would be ~£71,200 once January-March 2026 is added, which lives on the 2026 report.)
| Client | 2025 net revenue | Share |
|---|---|---|
| Acme Digital Ltd | £20,500.00 | 41% |
| Blue Sky Studios | £12,000.00 | 24% |
| PW Pro Ltd | £7,700.00 | 15% |
| Northwind Marketing | £6,800.00 | 14% |
| Riverside Coffee Co | £2,800.00 | 6% |
| Totals | £49,800.00 | 100% |
Spotting concentration risk
The single most useful question this report answers: what happens to my business if my biggest client leaves? If one client is more than 30-40% of your revenue, you're carrying real risk. If they're over 50%, you don't have a business - you have one customer with a contract.
In the example above, Acme Digital Ltd is 41% of 2025 revenue. That's the kind of share that should prompt a deliberate plan: pursue one or two more clients of similar size, push a retainer with Acme to make the relationship stickier, or both. The report doesn't tell you what to do - but it's how you spot the question in the first place.
When the numbers look off
| What you see | Likely reason |
|---|---|
| A client you invoiced is missing | Their year_total is zero for the calendar year you're viewing. Try the previous or next year - UK tax years split across two. |
| Revenue looks high | Drafts count. Check for draft invoices dated in the year and delete any you don't intend to send. |
| A cash sale is missing | Other Income only appears on this report if it has a client attached. Edit the entry and link a client. |
| No order to the rows | There's no sort - rows come out in client-creation order. Export to Excel and sort the Total column to rank clients. |
| The screen has a Totals row but the export doesn't | That's by design - exports are one row per client. Add a SUM() formula in your spreadsheet if you need it. |