
Reading the Time Summary report
How many hours did you actually work this month, what was billable, and how is it split across your clients? The Time Summary report rolls it all up in one grid.
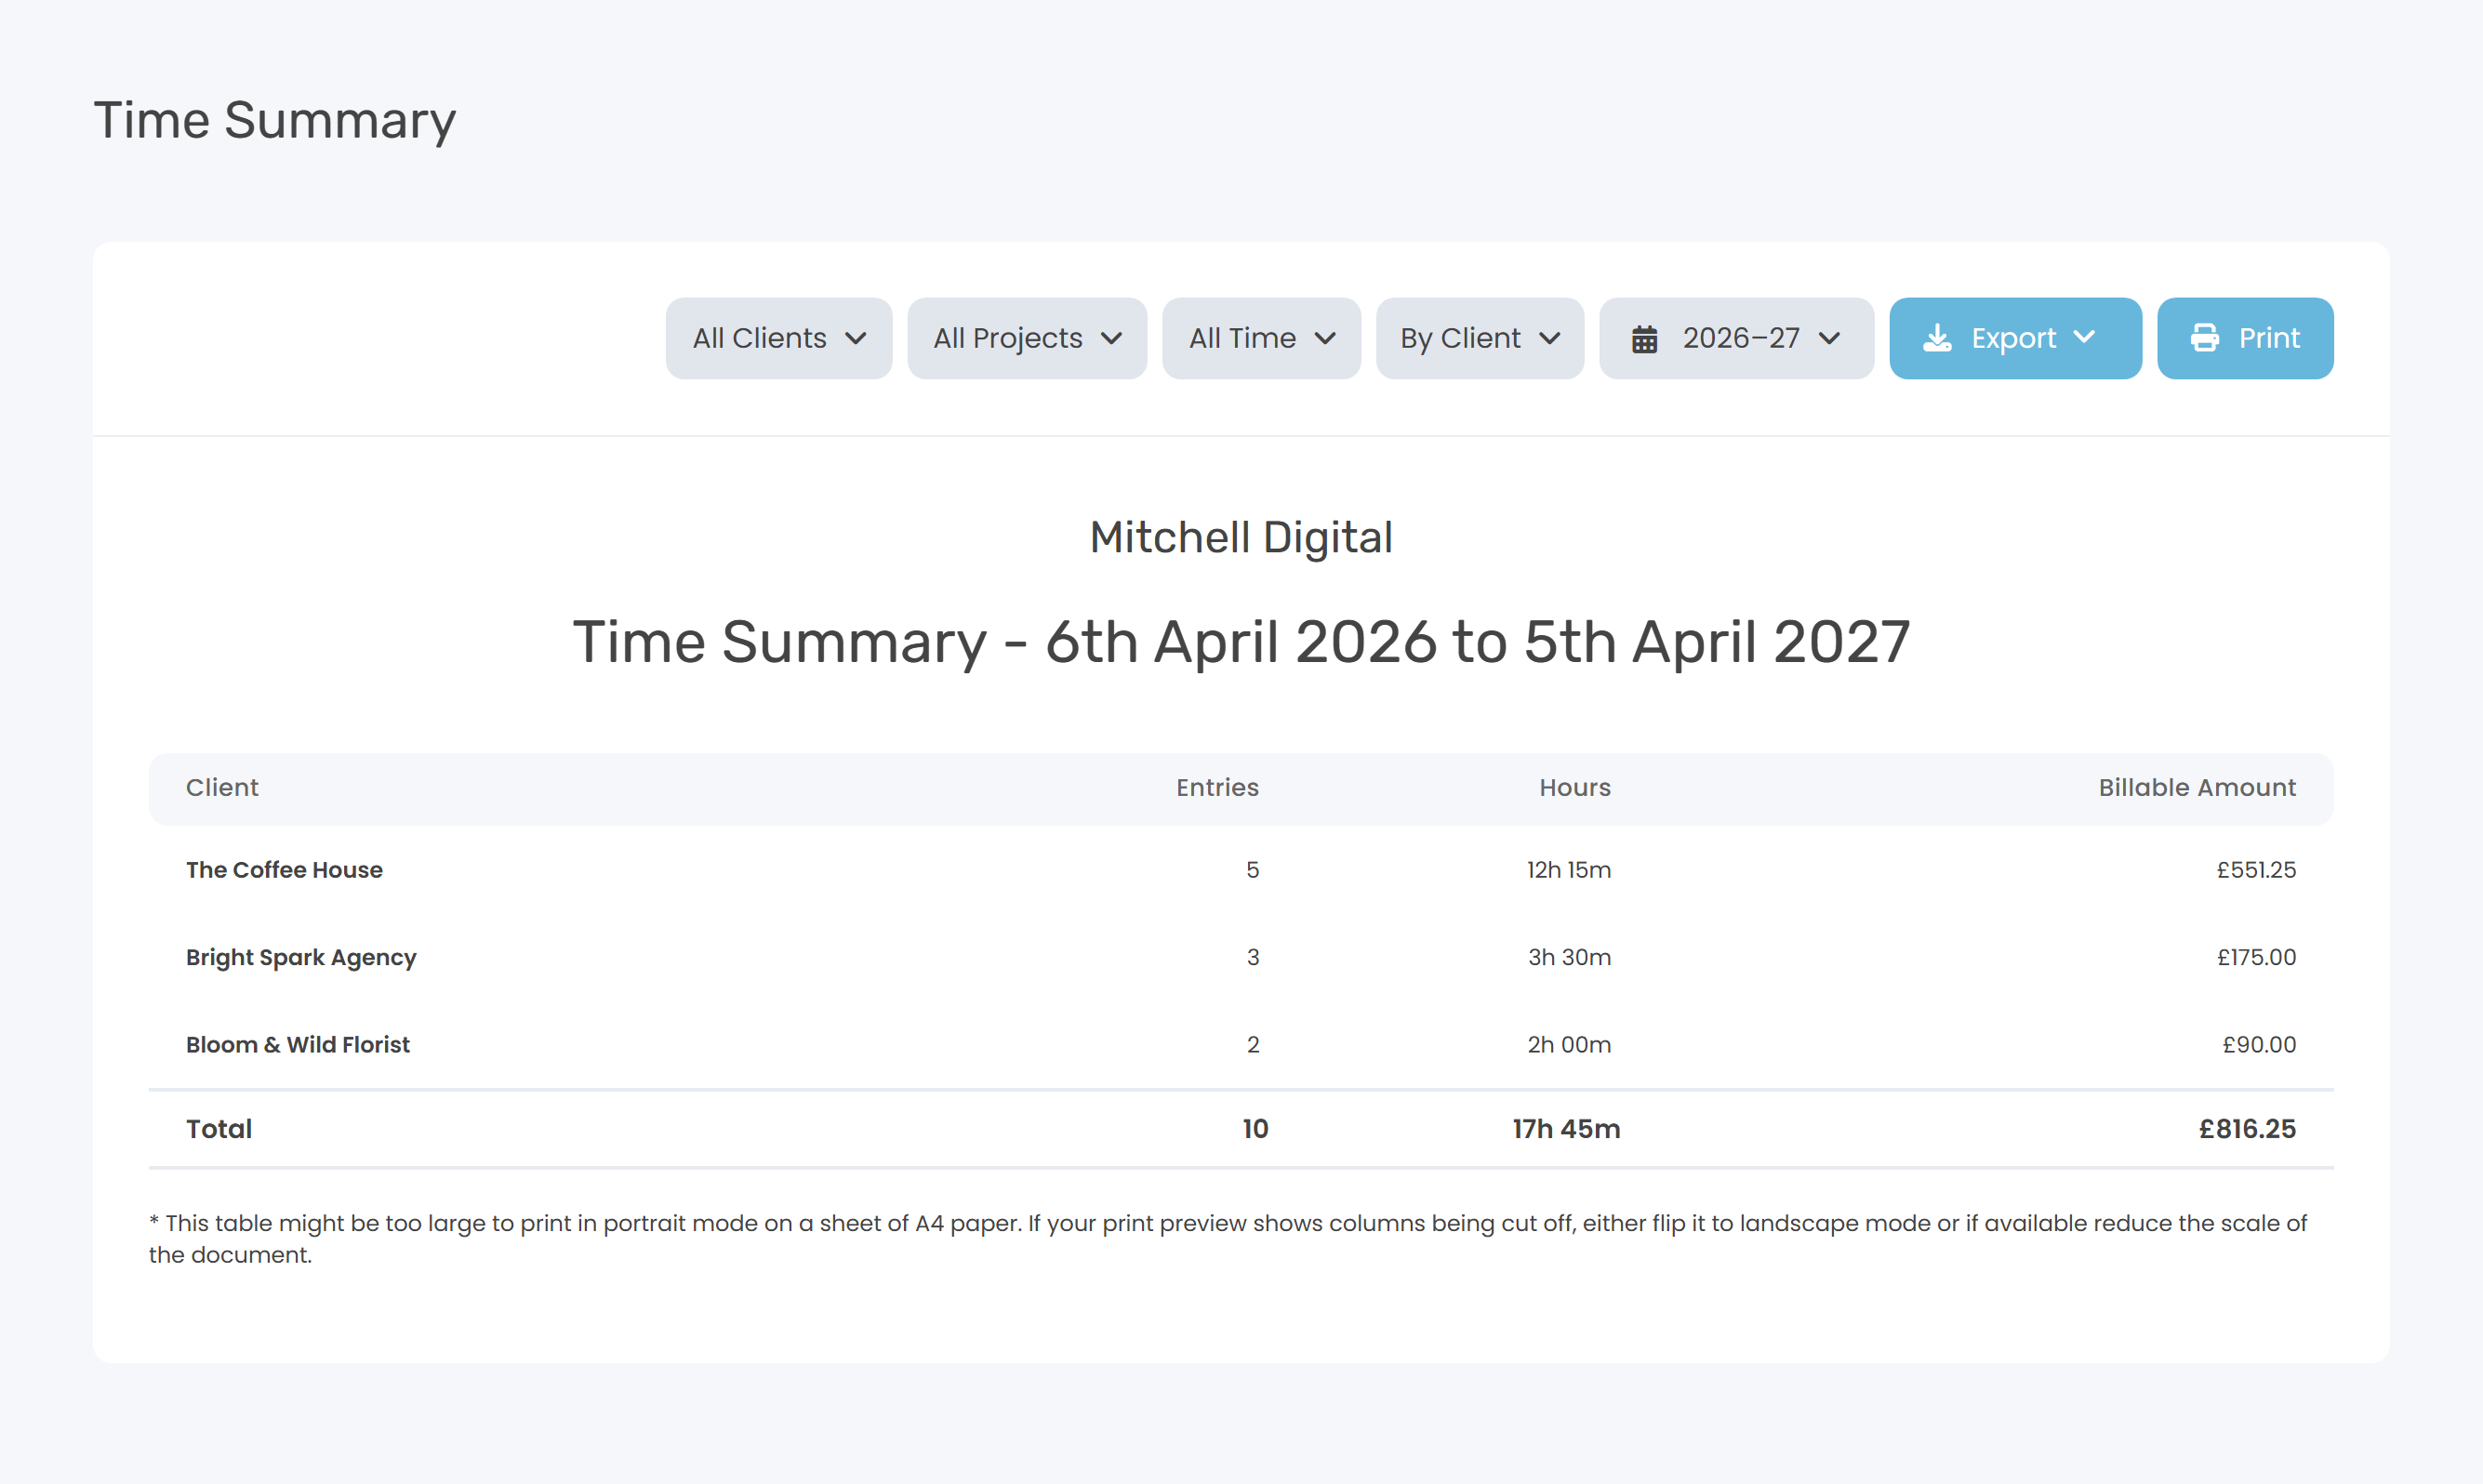
Time Summary is the bird's-eye view of your tracked time. Pick a date range, pick how you want it grouped - by client, project, task, description, day, or every single entry - and you get one row per group with the total hours, how many were billable, and what they were worth at your hourly rate. You'll find it at Time Summary, or click Reports in the sidebar and pick the Time Summary card under Time Tracking.
What it shows
| Column | What it means |
|---|---|
| Group label | The client, project, task, description or day - whatever you picked in the Group by dropdown. |
| Entries | How many individual time entries fall into that group within your chosen date range. |
| Hours | Total tracked time in the group, formatted Xh YYm (e.g. 4h 30m). Sub-hour totals show as Xm only. |
| Billable Amount | Sum of (duration × hourly rate) for the billable entries only. Non-billable entries contribute zero to this column, even though their hours are still counted. |
Filters at the top of the report
Client and Project
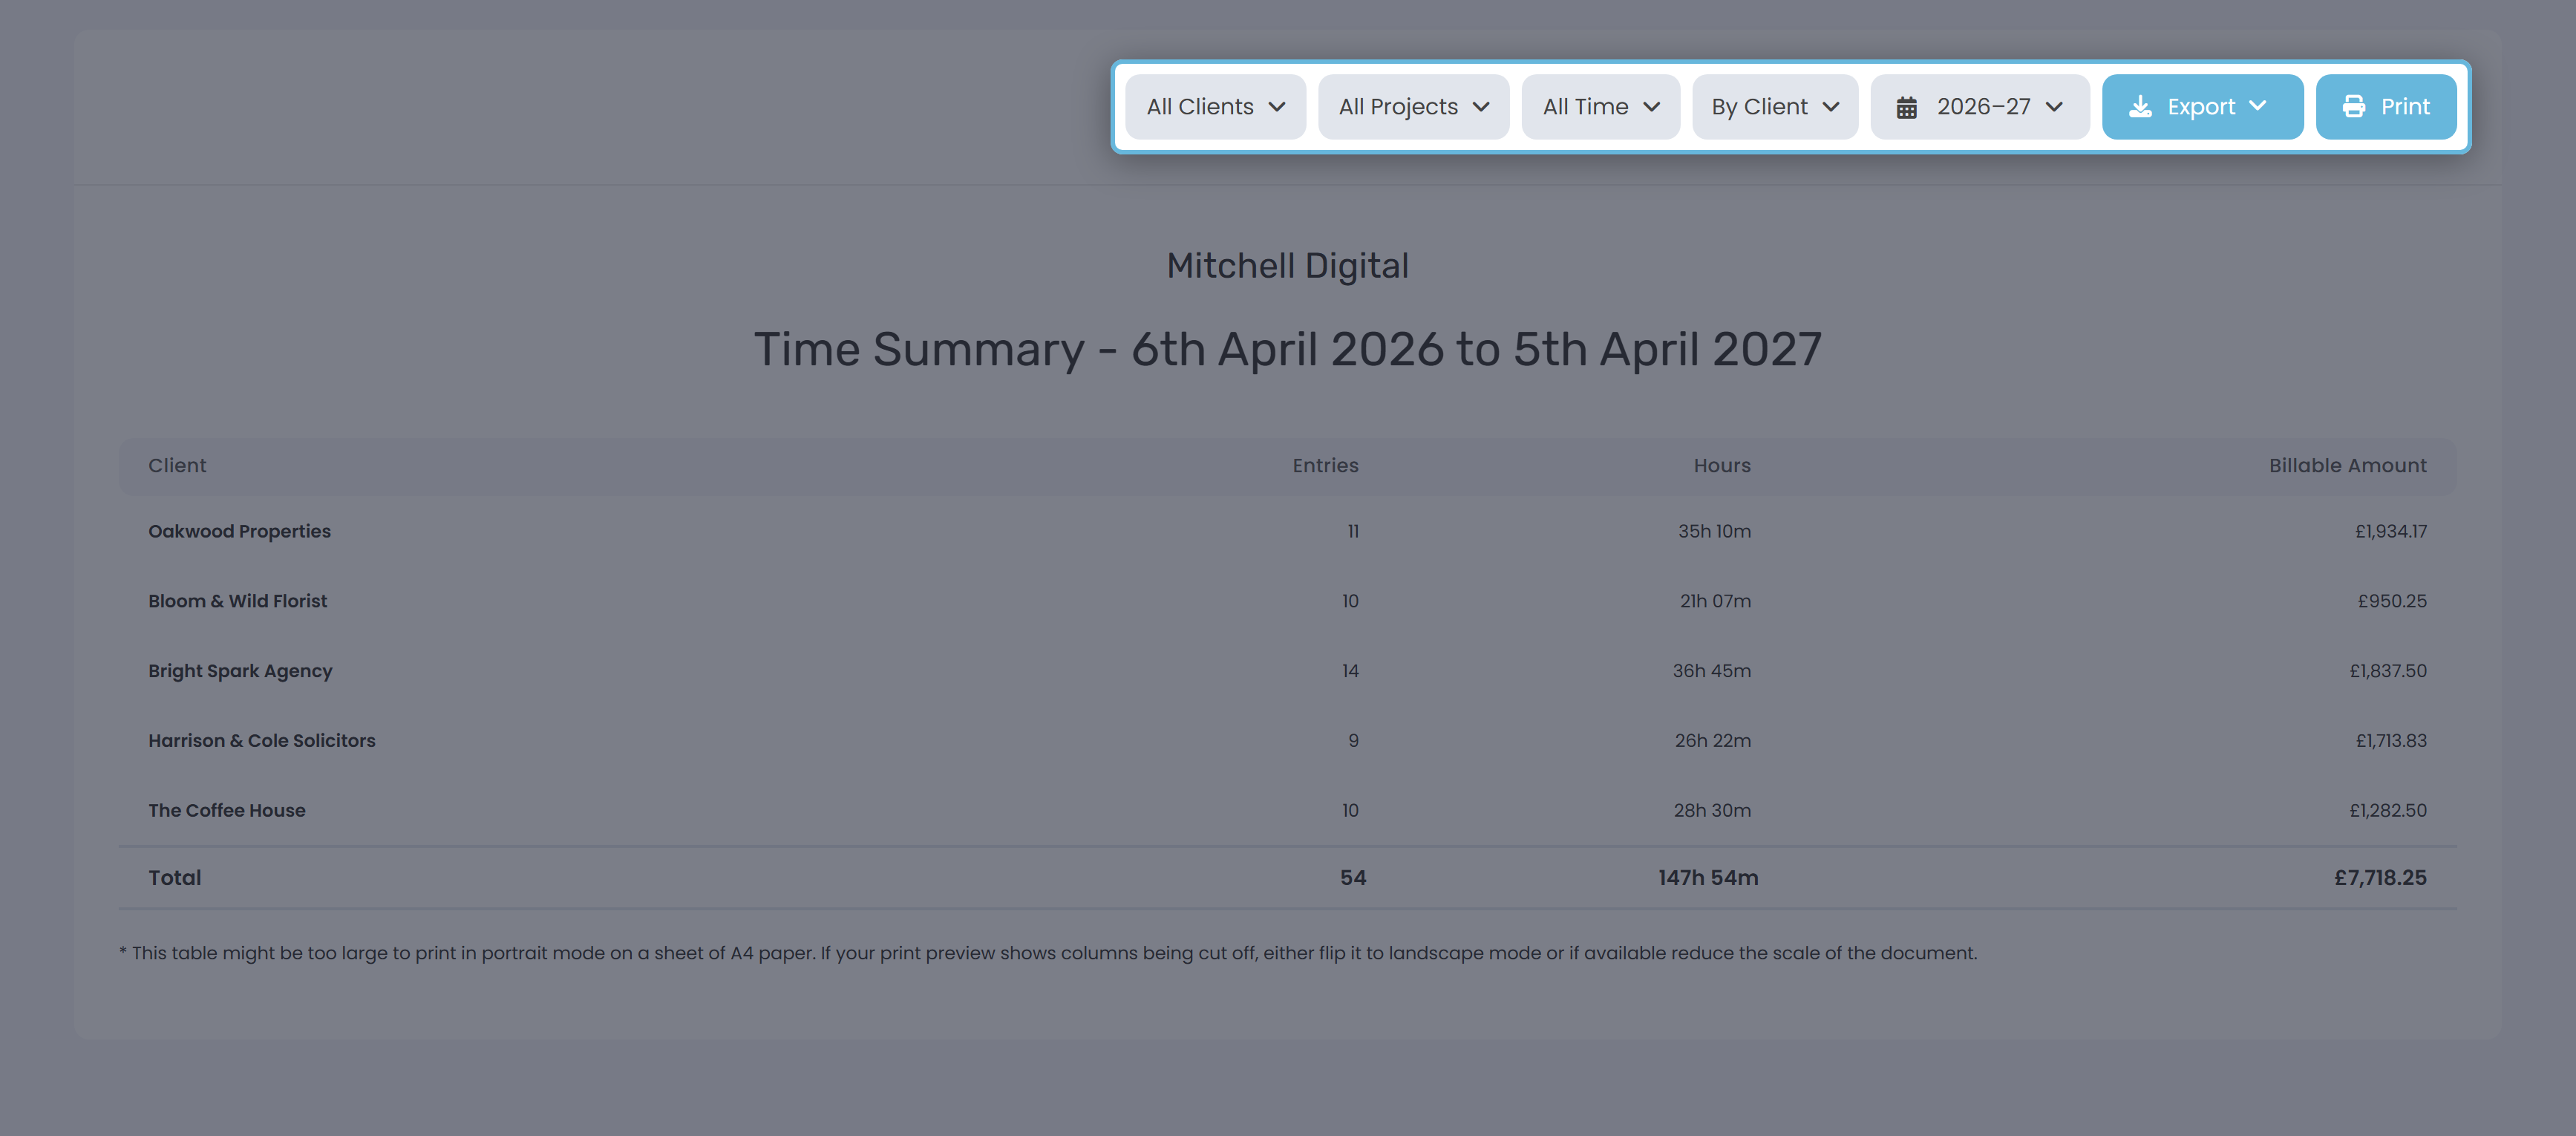
Both default to All. Start typing to filter the list. The Project dropdown only lists active projects - un-archive a project if you need to filter to it.
Billable
Three options: All Time (default), Billable Only, Non-billable Only. Setting it to Non-billable Only will show £0.00 in the Billable Amount column for every row - non-billable entries are never priced.
Group by
| Option | What it groups on |
|---|---|
| By Client (default) | One row per client. Entries with no client attached collapse into a single No Client row. |
| By Project | One row per project. The label includes the client in brackets - e.g. Website Redesign (PW Pro Ltd) - so two same-named projects under different clients stay distinct. |
| By Task | One row per task. Label format: Task title (Project / Client). |
| By Description | One row per unique description text. Identical descriptions merge across clients and projects - useful for spotting how much time you spend on recurring activities like admin or client call. |
| By Day | One row per calendar day, labelled like Mon, 1st April 2026. |
| Detailed | Swaps the four-column grouped table for an eight-column per-entry list (Date, Client, Project, Task, Description, Hours, Billable, Amount). Use this when you want to see every individual entry on one screen. |
Date range
Defaults to your current Financial Year - UK tax year if you're a sole trader, the year-end you've configured if you're a limited company. The presets cover Today, This Week, Last Week, This Month, Last Month, three financial years, three calendar years, and a Custom Range calendar.
Export and Print
Export gives you CSV or Excel (.xlsx). The file mirrors whatever's on screen - same grouping, same filters - and includes a Total row at the end. Print uses your browser's print dialog; there's a small note under the table reminding you to flip to landscape A4 if the columns get cut off.
What counts as tracked time
| Included | Not included |
|---|---|
| Finished entries (timer stopped or manual entry saved) | A running timer - stop it first |
| Manual entries and timer entries (treated the same) | Entries outside the chosen date range |
| All entries by default | Entries filtered out by the Billable / Client / Project pickers |
Time Summary vs Time Details
Time Summary's sibling is the Time Details report. They share the same toolbar, but they answer different questions.
| Time Summary | Time Details | |
|---|---|---|
| Default grouping | By Client | By Description |
| On screen | One row per group | Every entry, with group headers and subtotals |
| Per-entry view | Only in Detailed mode | Always |
| Customise export columns | No (always the full set) | Yes (tick which columns appear) |
| Total row in export | Yes | No |
| Best for | Roll-up totals, retrospectives, capacity planning | Itemised list, audit trail, attaching to an invoice |
In short: open Time Summary when you want a number; open Time Details when you want the line items behind it.
Worked example
Here's the report for a freelancer who's tracked time across the last 30 days - 17 entries, every one billable, charged at the default £50/hr. Grouped By Client:
| Client | Entries | Hours | Billable Amount |
|---|---|---|---|
| Acme Digital Ltd | 8 | 20h 30m | £1,025.00 |
| PW Pro Ltd | 6 | 18h 00m | £900.00 |
| Blue Sky Studios | 3 | 9h 00m | £450.00 |
| Total | 17 | 47h 30m | £2,375.00 |
Three numbers worth pausing on: 47.5 hours tracked, 100% billable, £2,375 of work to invoice. Acme Digital Ltd is the biggest client this month at 20.5 hours - roughly 43% of the tracked time.
Switching the same range to Detailed grouping gives you all 17 entries on one screen - perfect for exporting as a CSV to attach to an invoice as a timesheet.
How to use it
| Use case | How |
|---|---|
| End-of-month billable hours retrospective | Date range → Last Month. Group By Client. The Billable Amount column is your starting figure for invoices to raise. |
| Capacity planning | Date range covers a representative few weeks. Group By Day. Daily totals show where there's slack and where you're at the wall - useful before saying yes to a new retainer. |
| Unbilled value snapshot | Set Billable to Billable Only, group By Project. The Billable Amount column is the work that should turn into invoices soon. |
| Non-billable audit | Set Billable to Non-billable Only, group By Description. If the same admin tasks dominate every month, that's a candidate to systemise or price into your rate. |
| Sense-check a client conversation | Filter to one client, full FY. The Hours column tells you what you've actually delivered before quoting their renewal. |
When the numbers look off
| What you see | Likely reason |
|---|---|
| No rows at all | Either no finished entries in the range, or the Client/Project/Billable filter is excluding everything. The empty-state message will suggest adjusting the filters. |
| A current entry is missing | A running timer doesn't appear here - only finished entries do. Stop the timer and refresh. |
| Hours look high but Billable Amount looks low | You have non-billable entries in the mix. Switch the Billable filter to Billable Only to see just the priced hours. |
| A project you tracked time against isn't listed in the filter | Archived projects are hidden from the Project dropdown. Un-archive the project to filter to it. |
| A description appears once but you logged it many times | Group By Description merges identical text. If the labels were slightly different (Client call vs client call), they collapse together - case and whitespace are ignored. |